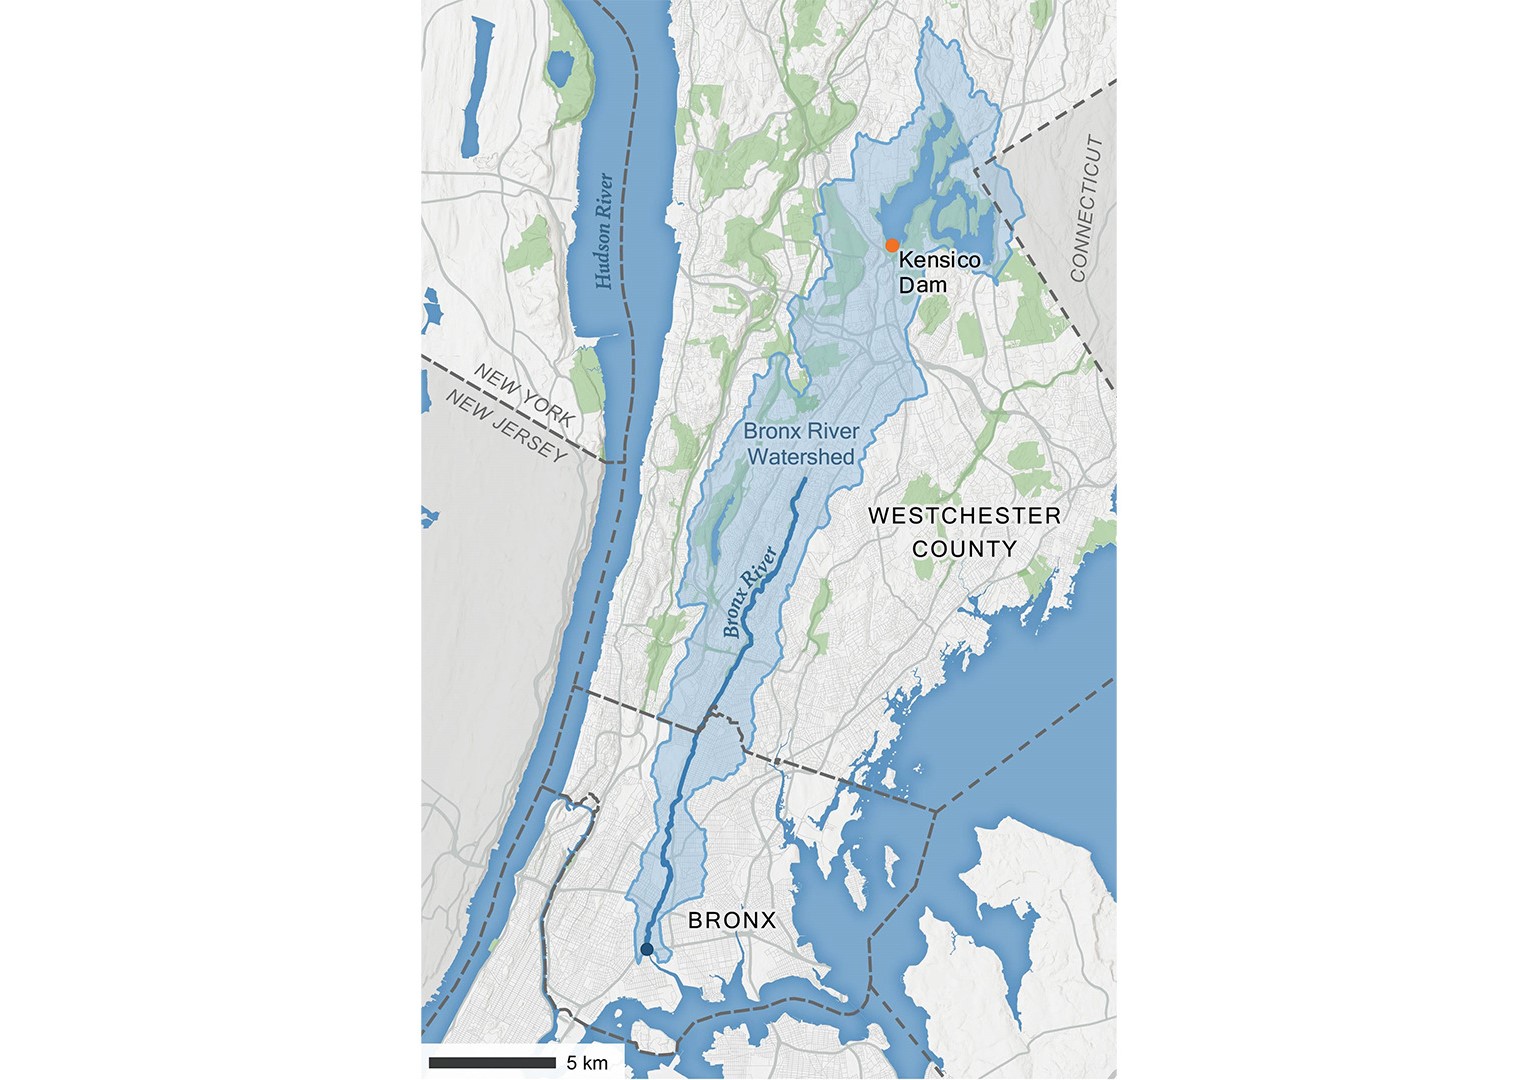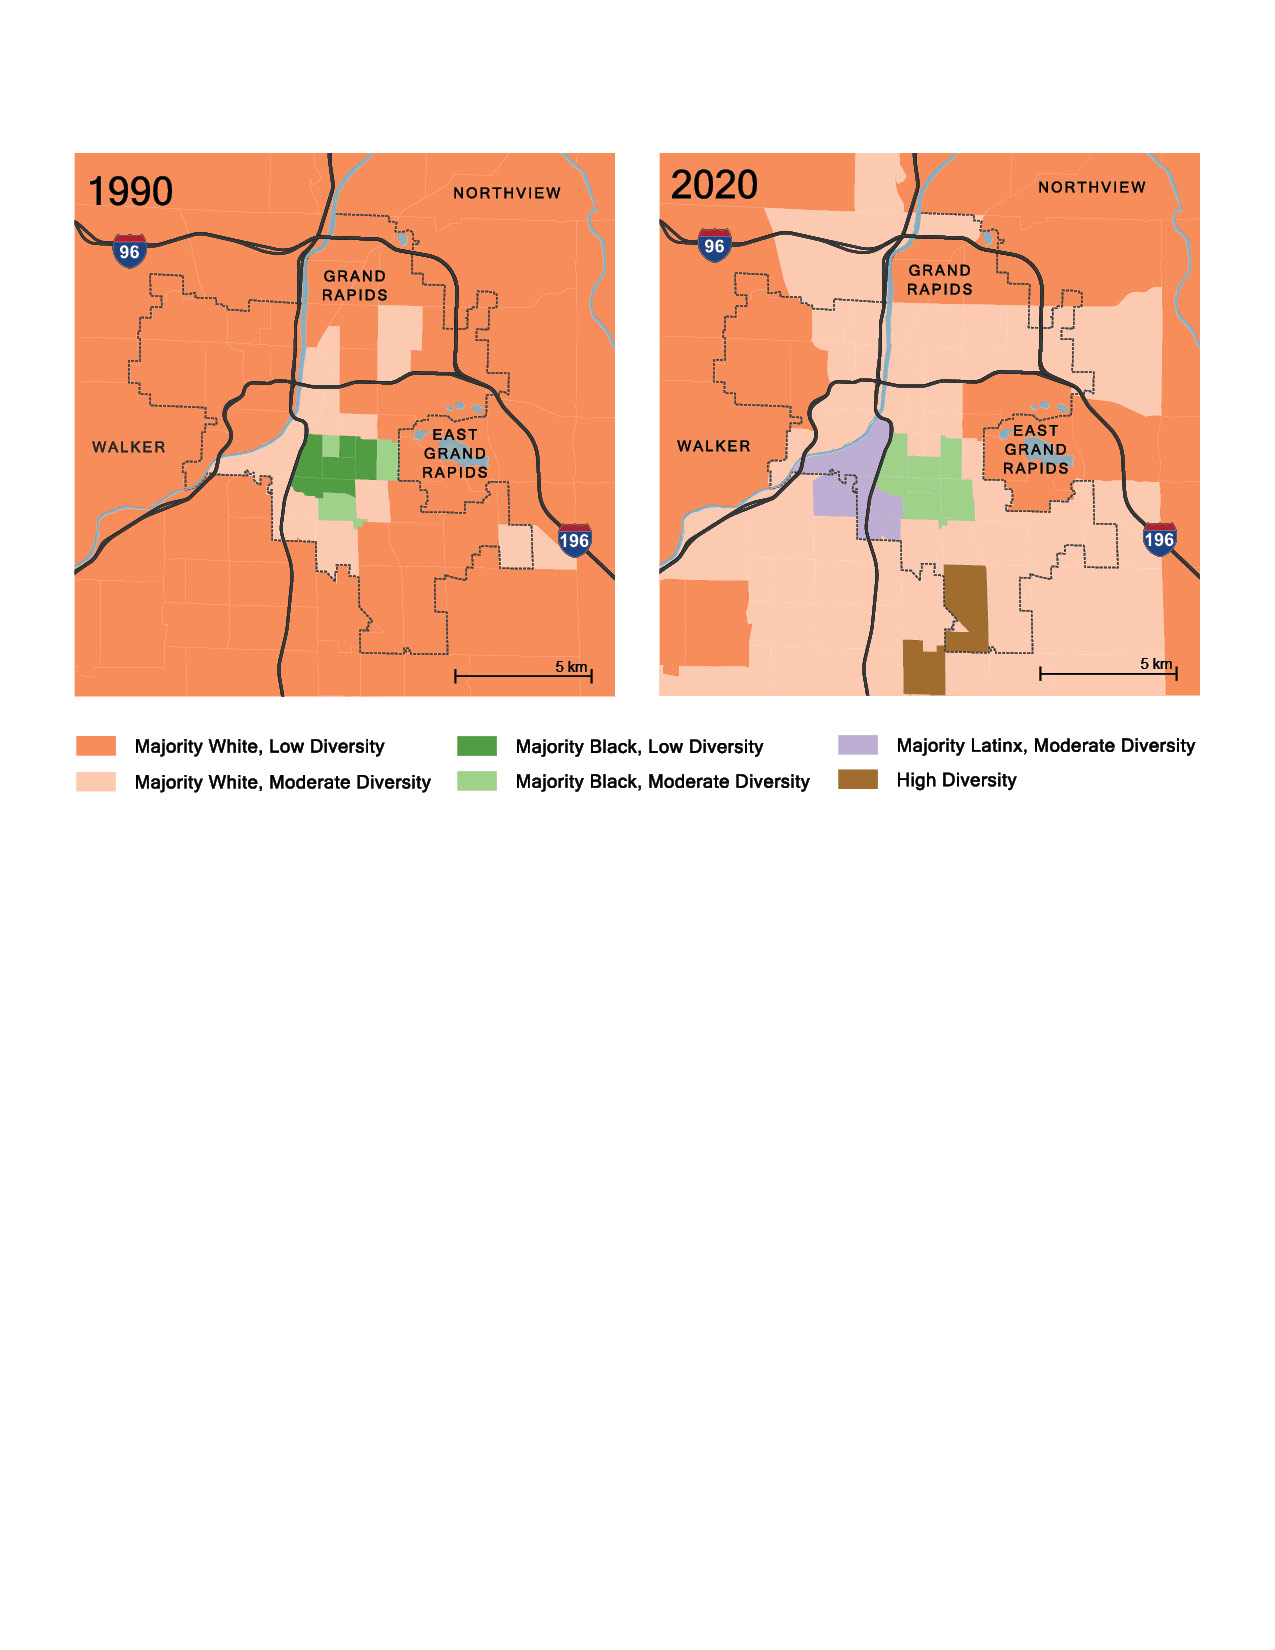
Series of context maps showing hydrology and diversity in LA, NYC, and Grand Rapids, MI. From Sneddon, C.S., Fox, C.A., Magilligan, F.J., & Bramsen, A.L. "Flows of justice? Situating environmental justice in urban river restoration". PLOS Water 5(5): e0000302. https://doi.
org/10.1371/journal.pwat.0000302
Process: Designed in QGIS and Adobe Illustrator.
Data Sources: Mixed Metro, City of Los Angeles Open Data Hub, US Census Bureau, Natural Earth, StreamStats, USGS, NYS GIS Clearinghouse, NYC Open Data, Westchester County GIS, Michigan Open Data.